The Business Case for Expanding Opportunity and Equity in Texas

Research Brief | March 20, 2017 | Ani Turner
Executive Summary
With low taxes and costs of living, a friendly business climate,1 and ample land and natural resources, the Texas economy has been growing faster than the national average for the past four decades. A growing population that is younger and more diverse than the national average is a tremendous potential asset for continued economic vitality in the decades ahead. However, the youngest and fastest-growing groups in Texas, those that will dominate the workforce in the near future, are also those that are currently furthest behind in education, health, earnings, and financial assets.2 The ability of businesses and the overall economy of Texas to grow depends on accelerating progress in closing today’s gaps in educational achievement and earnings potential for these groups.
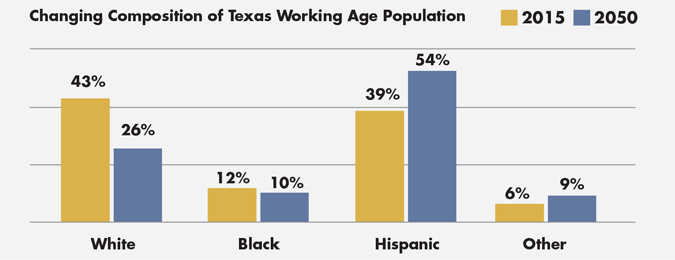
The Texas working age population (age 18-64) is projected to grow by 6.8 million people, a growth of more than 40 percent, and is expected to shift from predominantly White to predominantly Hispanic.
By 2050, Texas is projected to grow from about 27 million people to more than 40 million people.3 Virtually all of this growth comes from people of color, mostly people of Hispanic origins. The Texas working age population (age 18-64) is projected to grow by 6.8 million people, a growth of more than 40 percent, and to shift from predominantly White to predominantly Hispanic.
The average Hispanic or Black child in Texas today is more likely to be born into an environment leading to poorer health, lower educational attainment, fewer employment opportunities, and less financial security than the average White child.4 As today’s children of color become the majority adult population, their life outcomes will define the way the Texas workforce, customer base, neighborhoods, and communities evolve. The economic stakes, along with opportunities for significant gains, are high. As we show in this brief, even a modest acceleration in improvements in life outcomes for these groups represents billions of dollars in additional earnings, tax revenues, and purchasing power in the state.
Examples of current gaps in opportunity and life outcomes
One-third of Hispanic and Black children in Texas today live in poverty, compared to 11 percent of White and 12 percent of Asian children.5 Hispanic and Black children are also more likely to live in neighborhoods of concentrated poverty. Hispanic and Black adults are less likely to be homeowners and more likely to be incarcerated than their White counterparts. High school graduation rates have improved in Texas in recent years, but gaps remain – 93 percent of White, 95 percent of Asian, 84 percent of Black, and 86 percent of Hispanic students graduate.6
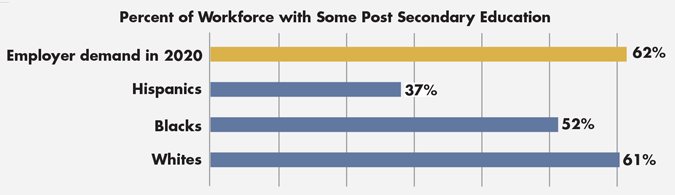
Educational achievement past high school already lags behind employer demand. Businesses in Texas import more than 90,000 people with a post-secondary education each year from outside the state.7 By 2020, 62 percent of jobs in Texas are expected to require some post-secondary education.8 Today, 61 percent of White, 52 percent of Black, and 37 percent of Hispanic adults in Texas have some post-secondary education.9 As Hispanics become a larger share of the workforce, the shortfall in educational credentials will increase unless these achievement gaps are closed.
Finally, earnings are a good summary measure of gaps because they reflect the combined effect of many areas where there are disparities, including education, health, employment opportunities, and incarceration rates. The average Hispanic person in Texas earns half what his or her White counterpart earns, while Blacks on average earn about 40 percent less and Asians earn about 20 percent less.10 Median net worth, which affects the ability to respond to unexpected expenses or to invest in a home, education, or business, ranges from $91,000 for Whites to $28,000 for Hispanics.11
Examples of potential economic gains from closing gaps
Closing gaps in education and health reduce the current gaps in earnings. If the average person of color in Texas achieved the average earnings of their White counterparts at each age group, total Texas earnings would increase by about one-third, or about $182 billion in 2015. The corresponding increase in the state’s total economic output would be $520 billion.12 By 2050, closing earnings gaps would increase state earnings by more than 50 percent, or $335 billion, increasing Texas economic output by nearly $2 trillion – an increase that is more than the current GDP of Canada, Australia, Korea, Spain, or Mexico.
Higher earnings mean more spending on goods and services. A $182 billion increase in earnings would mean about $18 billion more in food purchases, $5 billion in apparel and services, $24 billion in cars, gas, and transportation expenses, and $7.4 billion in entertainment.13 By 2050, closing earnings gaps would be associated with $34 billion more in food, $9 billion in apparel and services, $45 billion in transportation, and $13.6 billion more in entertainment spending. Earnings also bring in more tax revenues and decrease the need for social services spending, improving the fiscal outlook for the state. In 2015, closing earnings gaps would mean nearly $14 billion more in state and local tax revenues.14 By 2050, the additional $335 billion in earnings would generate more than $25 billion in additional state and local tax revenues.
Which path into the future?
Texans have a significant opportunity to improve educational outcomes and support a vital economy long into the future. Beyond earnings, higher education is associated with better health, longer life, less likelihood of being incarcerated, and more volunteering, charitable donations, and civic involvement.15 Groups around the state are already implementing policies and programs that are successfully reducing educational gaps and improving life outcomes.16 Supporting and investing in these initiatives as individuals, employers, and communities is not only the right thing to do, it can create a stronger and more prosperous Texas for all.
Notes
- Texas ranks in the top 10 in the Tax Foundation's State Business Tax Climate Index,has ranked either 1st or 2nd in the 10 years of CNBC's Top States for Business ranking, and consistently ranks 1st in the Best and Worst State Rankings in Chief Executive magazine’s annual survey.
- Murdock, Steve H. and Michael E. Cline, Mary Zey, P. Wilner Jeanty, Deborah Perez, Changing Texas: Implications of Addressing or Ignoring the Texas Challenge, Texas A&M University Press, 2014.
- Texas Demographic Center, Texas Population Projections Program, 2014 Population Projections by Age, Sex, and Race/Ethnicity, 2010-2050, middle series (assumes in-state migration continues at only half the pace seen from 2000 to 2010). http://osd.texas.gov/Data/TPEPP/Projections
- Center for Public Policy Priorities, Texas Kids Count Project, State of Texas Children 2016: Race and Equity, May 2016.
- Annie E. Casey Foundation KIDS COUNT Data Center, http://datacenter.kidscount.org/. Accessed May 9, 2016.
- Four-Year Regulatory Adjusted Cohort Graduation Rate, School Year 2013-14. Washington, DC: U.S. Department of Education, 2015.
- Hunt, Woody L, Chairman, Higher Education Strategic Planning Committee, “The Future of Higher Education in Texas” presentation slide 18. Cites 2011-2013 U.S. Census Bureau American Community Survey data.
- Carnevale, Anthony P., Nicole Smith, and Jeff Strohl, “Recovery: Job Growth and Education Requirements through 2020, State Report,” Georgetown University Public Policy Institute, Center on Education and the Workforce, June 2013.
- Murdock, Steve H. and Michael E. Cline, Mary Zey, P. Wilner Jeanty, Deborah Perez, Changing Texas: Implications of Addressing or Ignoring the Texas Challenge, Texas A&M University Press, 2014, Table 4.9, page 54.
- PolicyLink/PERE National Equity Atlas, economic indicators for Texas, http://nationalequityatlas.org/indicators. Accessed March 21, 2016.
- Corporation for Enterprise Development, Assets & Opportunity Scorecard, http://scorecard.assetsandopportunity.org/latest/state/tx. Accessed May 29, 2016. In 2011 dollars, calculated by Haveman Economic Consulting using the Survey of Income and Program Participation.
- Author’s calculations based on current earnings gaps, middle series population projections from the Texas Demographic Center, and GDP projections from the Texas Comptroller of Public Accounts Fall 2015-16 Texas Economic Forecast.
- Bureau of Labor Statistics Consumer Expenditure Survey.
- The Tax Foundation estimates Texas collects 7.6 percent of income in state and local taxes. http://taxfoundation.org/state-tax-climate/texas
- Trostel, Philip for the Lumina Foundation, It’s Not Just the Money: The Benefits of College Education to Individuals and Society.
- Turner A, Beaudin-Seiler, B, “Programs for Expanding Opportunity and Equity in Texas,” March 2017.